
Overview
Purpose and Context
The US Influenza project was a project I completed as part of my data analytics course at CareerFoundry. This project showcases my skills in data analysis with Excel and visualization with Tableau.
Data
Datasets used for this project:
Influenza Deaths by Geography Dataset
This dataset includes the number of deaths due to influenza by age group for every month of each year from 2009-2017 for each US state. Some of the death counts are suppressed for privacy reasons, and due to this, some influenza deaths data is missing. This dataset is from the Center for Disease Control (CDC) and the data was collected through the US government’s vital statistics program.
Population Data by Geography, Time, Age, and Gender Dataset
This dataset includes the numbers for total population, male total population, female total population and populations of each age group (groups of 5 years) in each county in the United States from 2009-2017. Some counties are missing data for one or more years. This dataset is from the US Census Bureau and the data was collected through the census.
Influenza Visits Dataset
This dataset includes weekly amounts for the total number of patients that were seen by healthcare providers, the number of providers that saw the patients, and the percentage of visits. This dataset includes data for each state from 2010-2019. Some data is missing for the Commonwealth of the Northern Mariana Islands, Puerto Rico, and the Virgin Islands and for weeks 36-39 and 53 of the year. This dataset is from the Center for Disease Control’s Fluview and the data was collected through surveys.
Tools
- Microsoft Excel: To clean and analyze data.
- Tableau Public: To generate visualizations.
Techniques
The following techniques were used in this project:
- Data profiling
- Data cleaning
- Data quality checks
- Data transformation
- Data integration
- Descriptive statistics
- Statistical hypothesis testing
- Storytelling with Tableau
Preprocessing Data
Prior to analyzing the data, I did the following in preparation for the project and to ensure that the data was ready for analysis:
- Translating business requirements into various questions
- Developing a project management plan
- Summarizing data sources and collection methods, and creating an overview of data contents
- Creating data profiles and checking data integrity
- Assessing data quality
- Addressing data integrity and data quality issues
- Transforming and integrating the data sets
- Calculating summary statistics
Analyzing Data
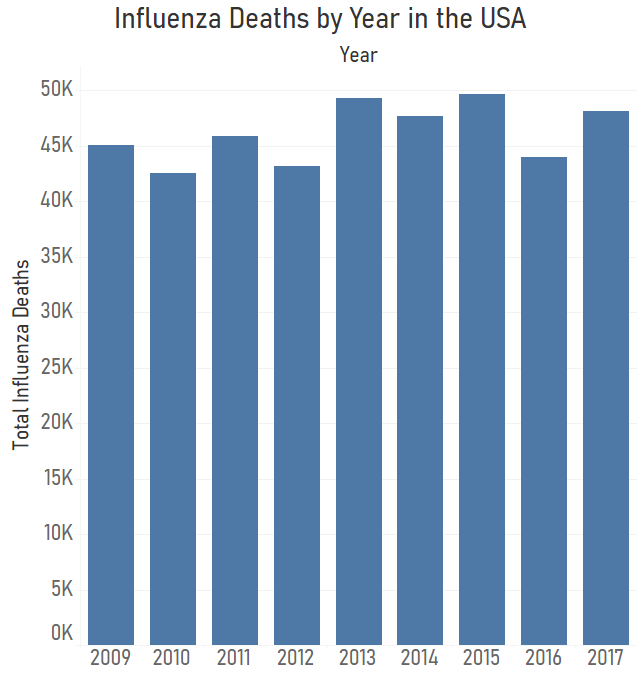
First, I looked at the total deaths due to influenza by year in the USA from 2009-2017 to see how many additional patients medical staff would be needed for. The total deaths due to influenza are between 40,000 and 50,000 every year.
Identifying the Vulnerable Population
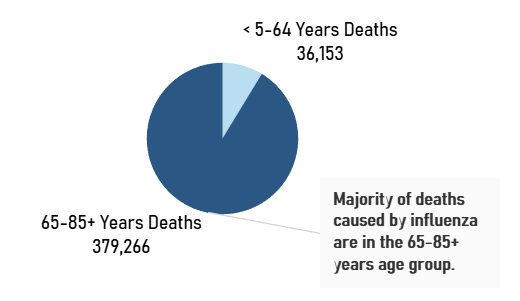
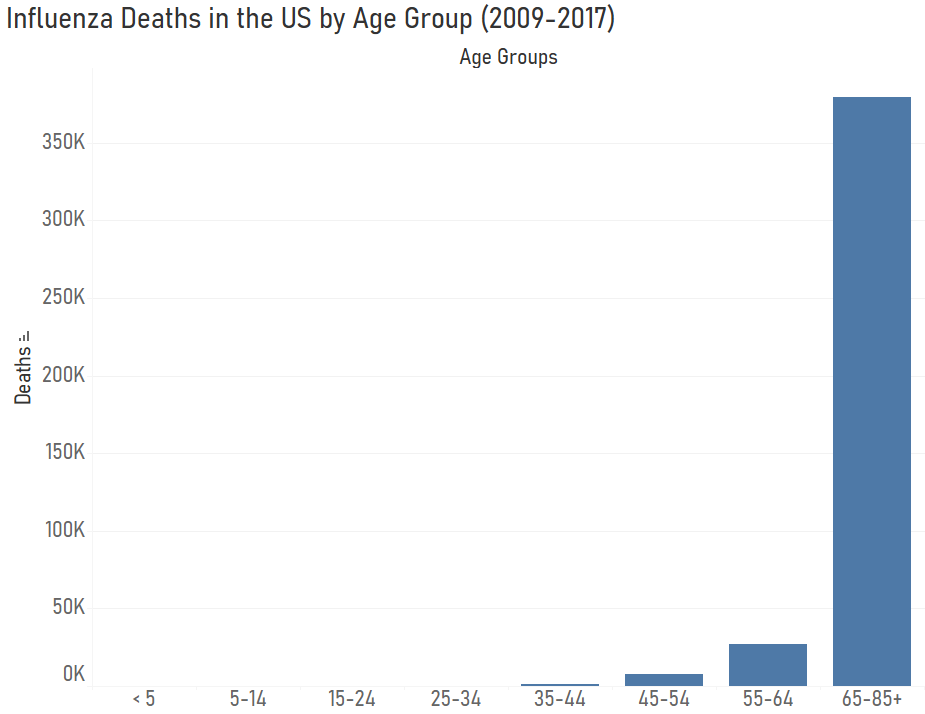
I divided the deaths due to influenza by age group and found that the greatest number of deaths occur in the 65-85+ years age group. This age group is the most vulnerable age group.
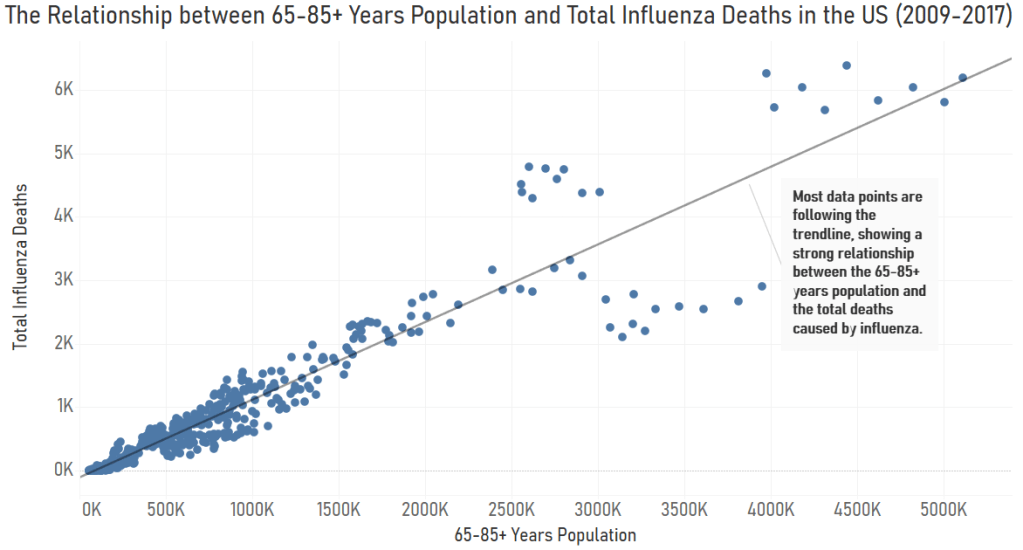
Since most deaths due to influenza occur in the 65-85+ years age group, I hypothesized that if there is a greater population of people of higher ages in a state, then the state will have a higher rate of mortality due to influenza.
As one way of testing my hypothesis, I ran a correlation test between the 65-85+ years Population and Total Deaths variables and obtained a correlation coefficient of 0.95, indicating that there is a strong positive relationship between the two variables. This means that as 65-85+ years Population increases, Total Deaths also increase.
Following the correlation test, I conducted statistical hypothesis testing to test my hypothesis. To conduct this test, I developed null and alternative hypotheses. The null hypothesis states that a higher population of people of greater ages in a state leads to a lower rate of mortality due to influenza. The alternative hypothesis states that a higher population of people of greater ages in a state leads to a higher rate of mortality due to influenza. The p-value obtained from the test is 3.43E-64 which is much smaller than the significance level of 0.05, which means that the null hypothesis could be successfully rejected.
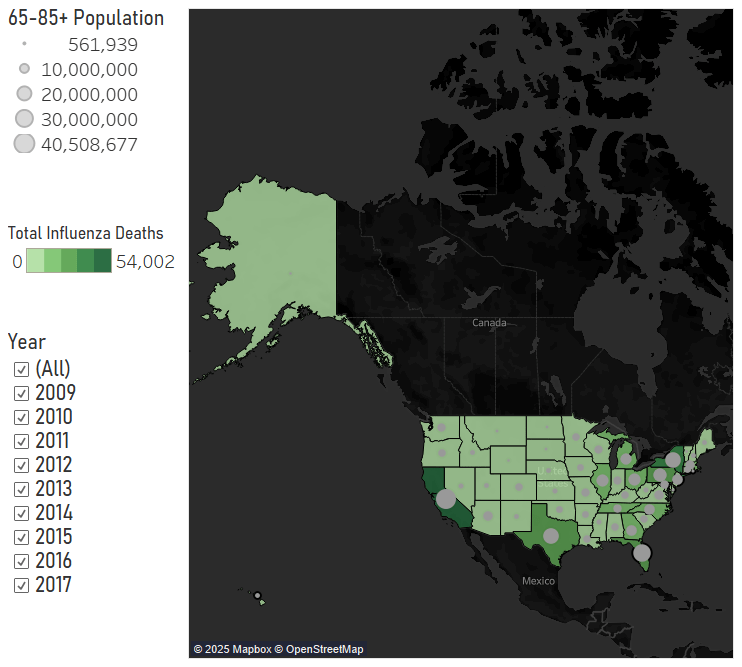
Comparison Across States
For each US state, I looked at the population of people ages 65-85+ and total influenza death counts on a geographical plot to identify which states will require more medical staff to treat influenza patients. The states with the largest populations of people ages 65-85+ and most influenza deaths are California, New York, Texas, Pennsylvania, and Florida.
Timing of Influenza
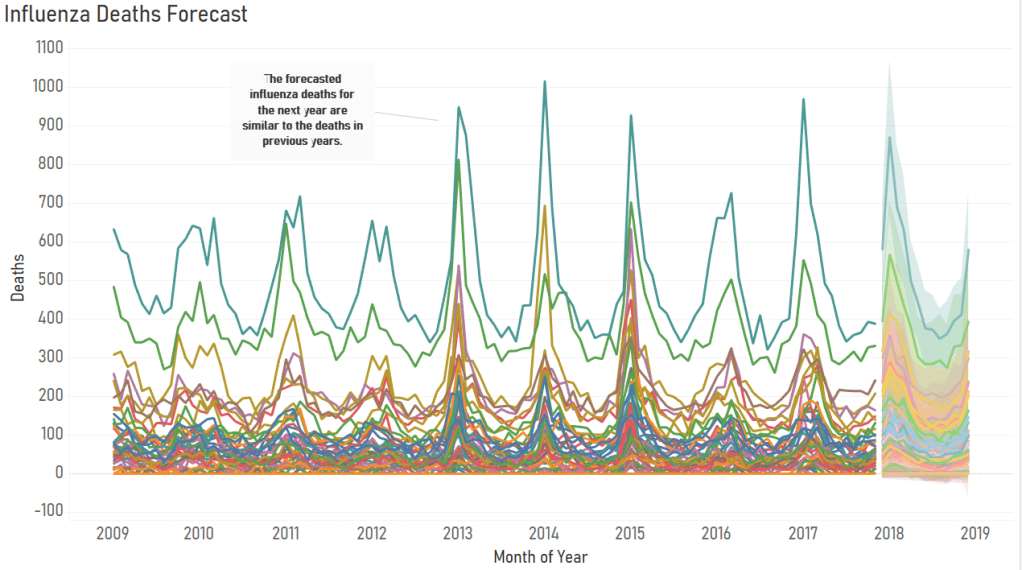
To determine whether influenza occurs seasonally or throughout the year, I analyzed the influenza death counts in each state by month of the year on a line chart. This led to the discovery that influenza occurs seasonally and results in the most hospitalizations and deaths in January-April and December. This seasonality of influenza is the same every year.
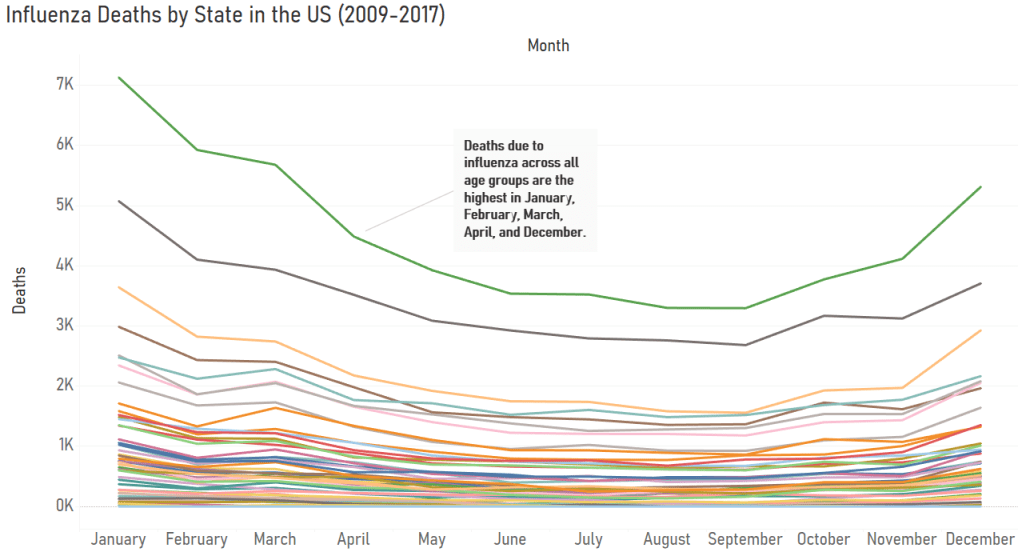
The forecasted influenza deaths for the next year are similar to those in previous years, so I can create a staffing plan for the upcoming influenza season with the assumption that influenza death counts for this upcoming influenza season will be similar to those in previous years.
Challenges
Many influenza death counts for many of the age groups for some months are suppressed if the death count is less than 10, and due to this, some influenza deaths data is missing. I did not impute any death counts to replace the suppressed values as there were too many death counts that were suppressed.
Tableau Storyboard and Video Presentation
You can access my Tableau Storyboard to see the visualizations generated for this project along with the highlights of the analysis. You can also access my video presentation of my Tableau Storyboard.
Results and Recommendations
Here are the results of the analysis along with recommendations for the staffing plan:
- The most vulnerable age group is 65-85+ years.
- States with larger populations of people in the 65-85+ age group have higher mortality numbers due to influenza.
- The states with the largest 65-85+ years populations and highest influenza mortality numbers are California, New York, Texas, Pennsylvania, and Florida.
- Influenza is seasonal and most deaths occur in January-April and December.
- The medical staffing agency should allocate more medical staff to California, New York, Texas, Pennsylvania, and Florida than the other states as these states are of higher priority than the others.
- The medical staffing agency should send their staff to each state before December 1st and the staff should remain there until the end of April.
Next Steps
- Collect data on the number of influenza patients admitted to hospitals in each state in the past and the number of available medical staff the medical staffing agency has, then determine an appropriate staff-to-patient ratio to determine how many staff members to send to each state.
- Collect data on the number of people of all ages that received flu vaccines in all states and determine if there is a relationship between flu vaccines administered and influenza deaths.

You must be logged in to post a comment.