Overview
Purpose and Context
The Instacart Grocery Basket project was a project I completed as part of my data analytics program at CareerFoundry. This project showcases my skills in data analysis and visualization with Python.
Key Questions
- What are the busiest days of the week and hours of the day?
- Are there particular times during the day when people spend the most money?
- How can different price range groupings be applied to products?
- Are there certain types of products that are more popular than others?
- What’s the distribution among users in regards to their brand loyalty?
- Are there differences in ordering habits based on a customer’s loyalty status?
- Are there differences in ordering habits based on a customer’s region?
- Is there a connection between age and family status in terms of ordering habits?
- What different classifications does the demographic information suggest? Age? Income? Certain types of goods? Family status?
- What differences can you find in ordering habits of different customer profiles?
Data
Datasets used for this project:
Customers Dataset
This dataset includes the name, gender, state, age, number of dependents, family status, and income of fictional Instacart customers. This dataset was created by CareerFoundry.
Departments Dataset
This dataset includes department IDs and department names.
Orders Dataset
This dataset includes details about orders placed by each Instacart user.
Products Dataset
This dataset includes details about the products available on Instacart.
Orders_products_prior Dataset
This dataset includes the add-to-cart number of products and data on if a product was reordered.
Tools
- Python and Jupyter Notebooks: To write and execute code.
- Numpy: For numerical operations.
- Pandas: For data analysis, cleaning, and manipulation.
- OS: For connecting with the device’s operating system.
- Matplotlib.pyplot: For creating various types of visualizations.
- Seaborn: For creating statistical visualizations.
Techniques
The following techniques were used in this project:
- Data cleaning
- Data wrangling
- Data subsetting
- Data merging
- Data grouping
- Aggregating variables
- Deriving variables
- Data visualization in Python
Data Processing
Prior to analyzing the data, I merged the Orders, Orders_products_prior, and Products datasets. During data analysis, I merged the Customers and Departments datasets into the dataset that was merged prior to analysis. During analysis, I created an ‘activity_flag’ column which labeled customers as low-activity customers or high-activity customers based on the number of orders placed. Customer profiling was conducted on a subset of the merged dataset which contained data only for high-activity customers. Personally identifiable information was removed from the data.
Analyzing Data
Exploring Sales Trends
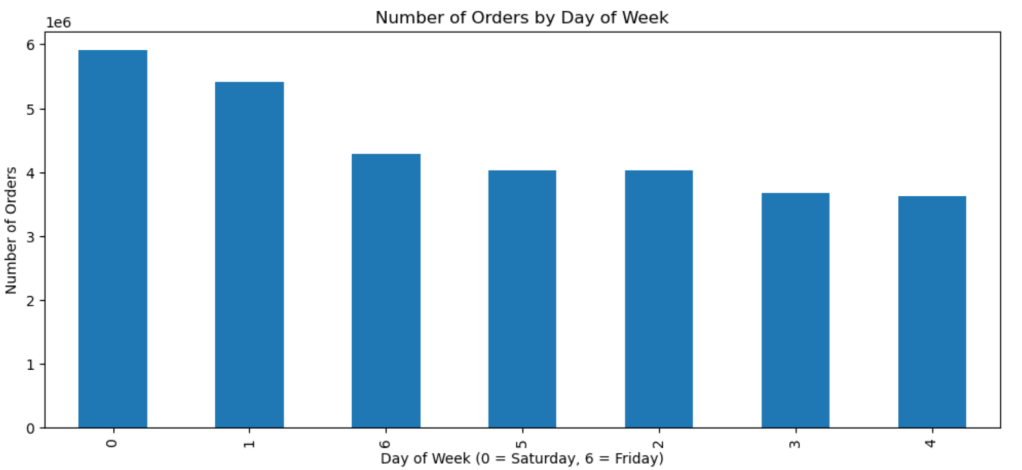
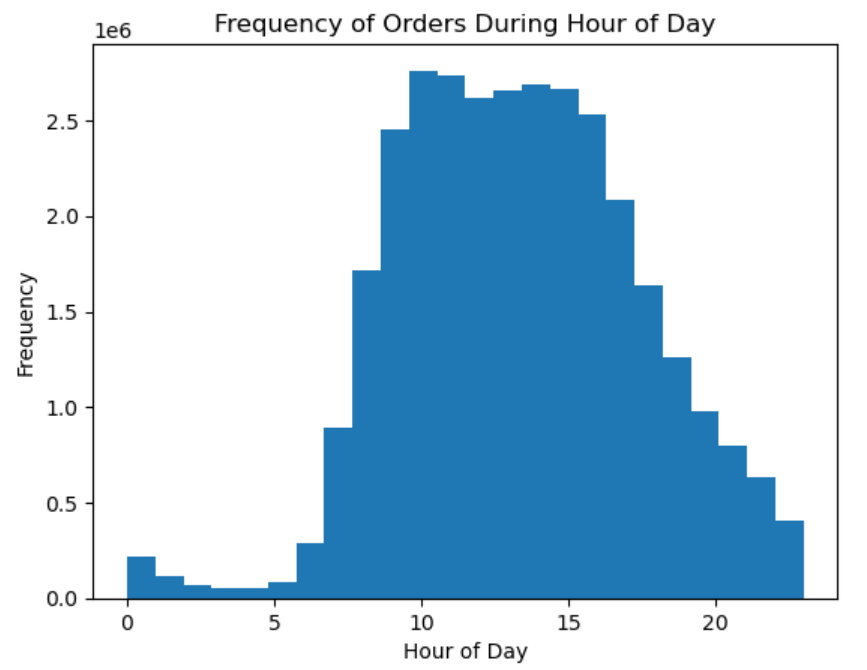
First, I derived two new variables in the dataset, ‘busiest_days’ and ‘busiest_period_of_day’ to label the day of the week and hour of the day in terms of how busy it is for orders. The busiest days of week in terms of orders placed are Saturday, Sunday and Friday. The busiest hours of the day in terms of order frequency are between 8am and 6pm, with the highest frequency of orders being placed between 10am and 12pm.
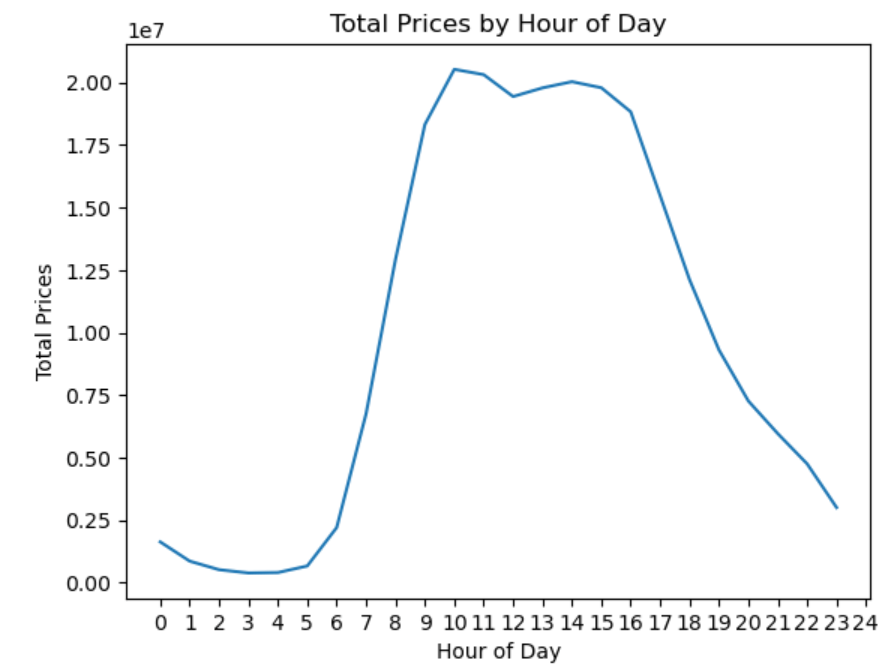
Instacart customers spend the most money at 10am.
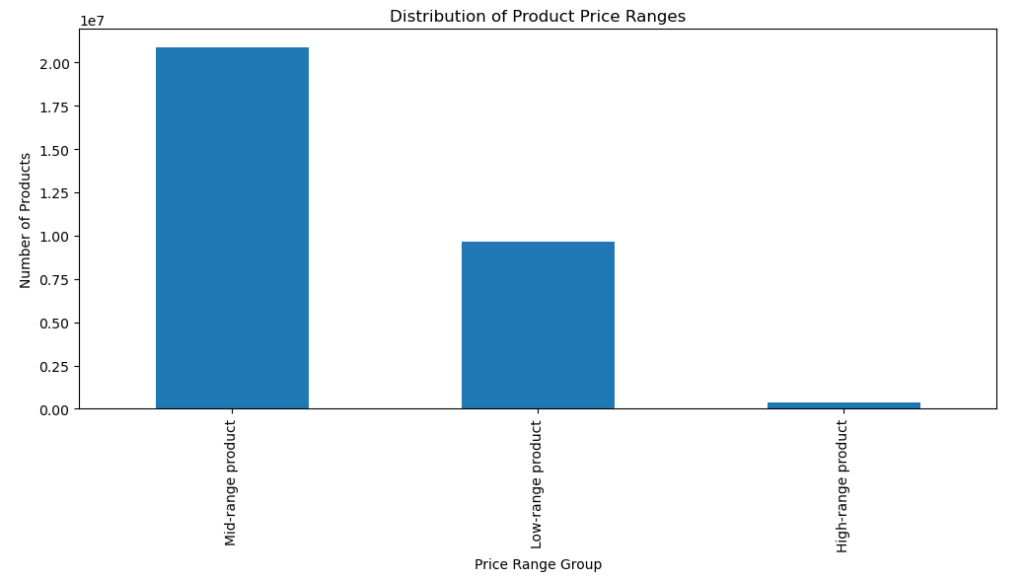
Most products sold by Instacart are mid-range products.
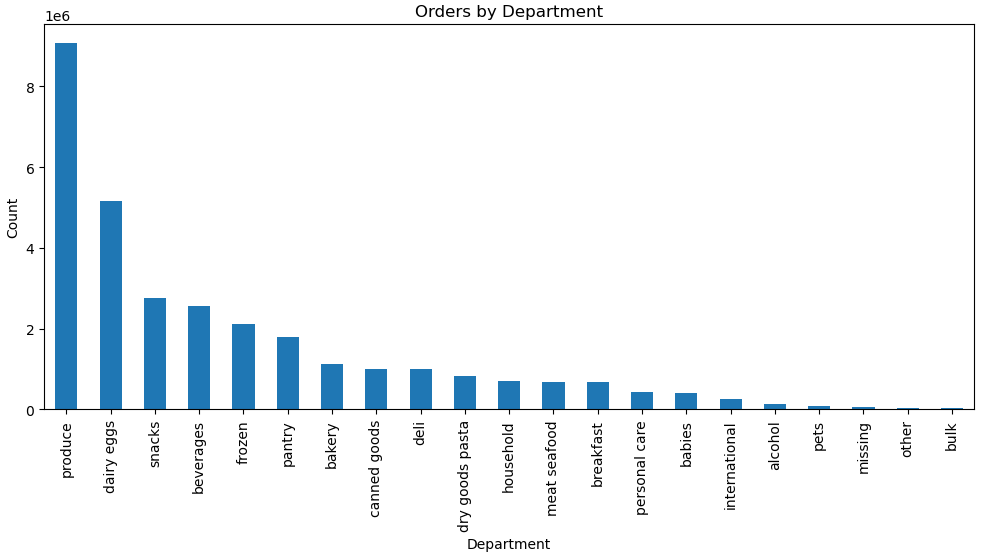
Then, I looked at the number of orders by department. The produce, dairy eggs, and snacks departments are the most popular departments from which products are ordered.
Customer Profiling
I created several new variables through variable derivation or aggregation to place customers and products into categories such as the ‘loyalty_flag’ variable which labeled customers as loyal, regular, or new based on the number of orders placed, ‘price_range_loc’ which labeled products as high-range, mid-range, or low-range products based on the product price, ‘spending_flag’ which labeled customers as high or low spenders, and more.
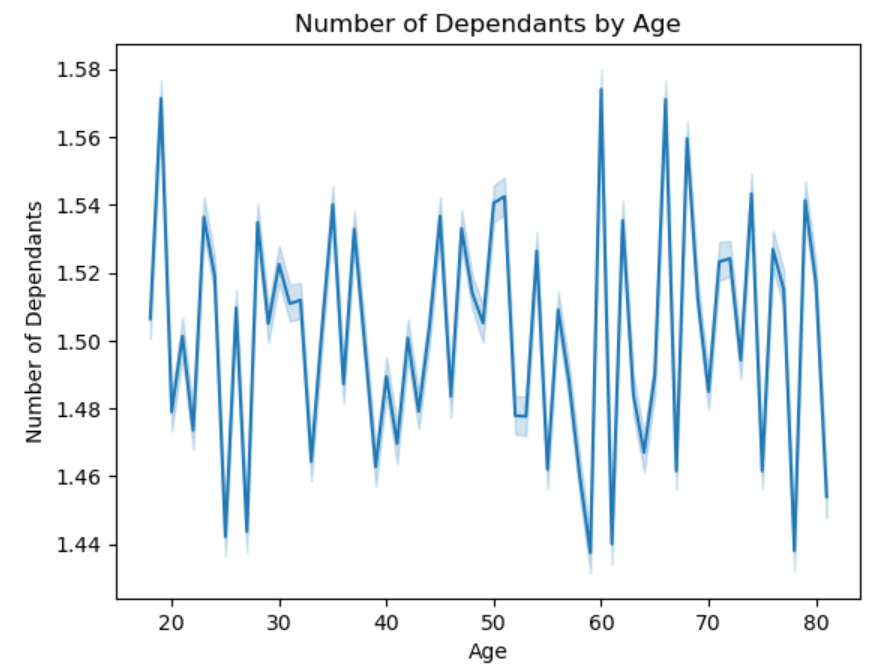
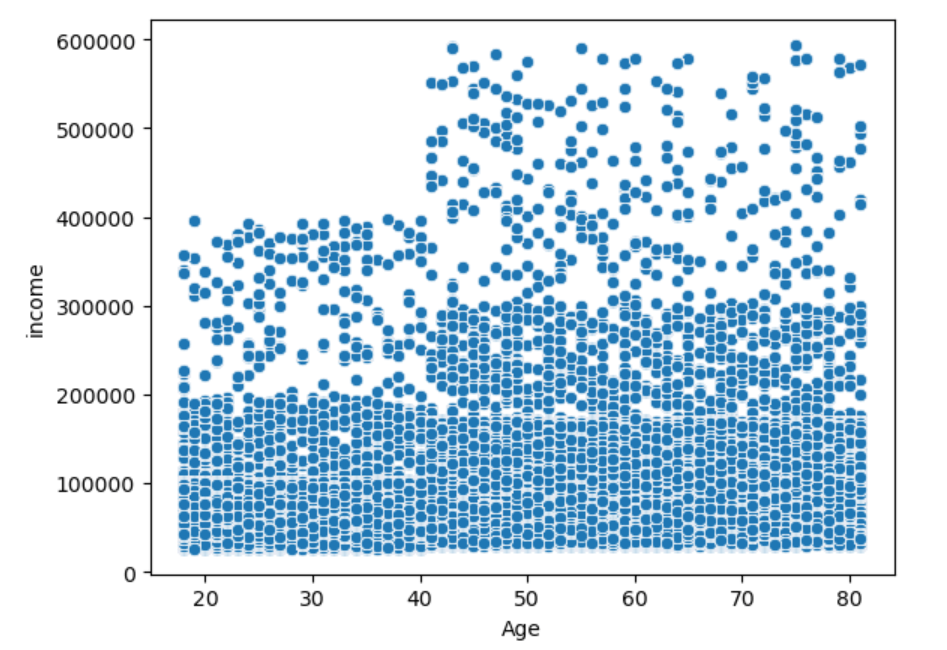
I created visualizations to see the relationships between some of the variables. The line chart created to look at the relationship between age and number of dependents did not show any correlation between both variables. The scatterplot created to look at the relationship between age and income showed that there may be some connection between these variables since there is a large increase in the number of people that have higher incomes after the age of 40.
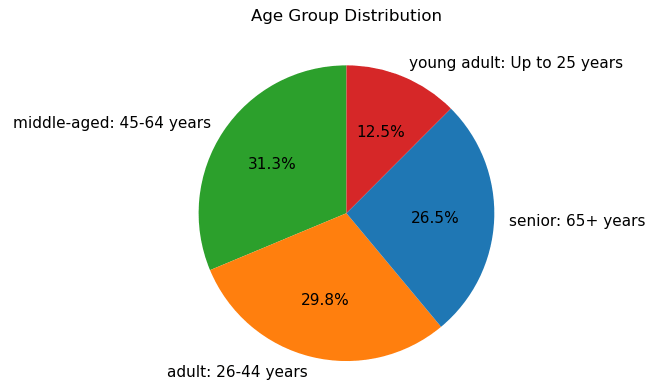
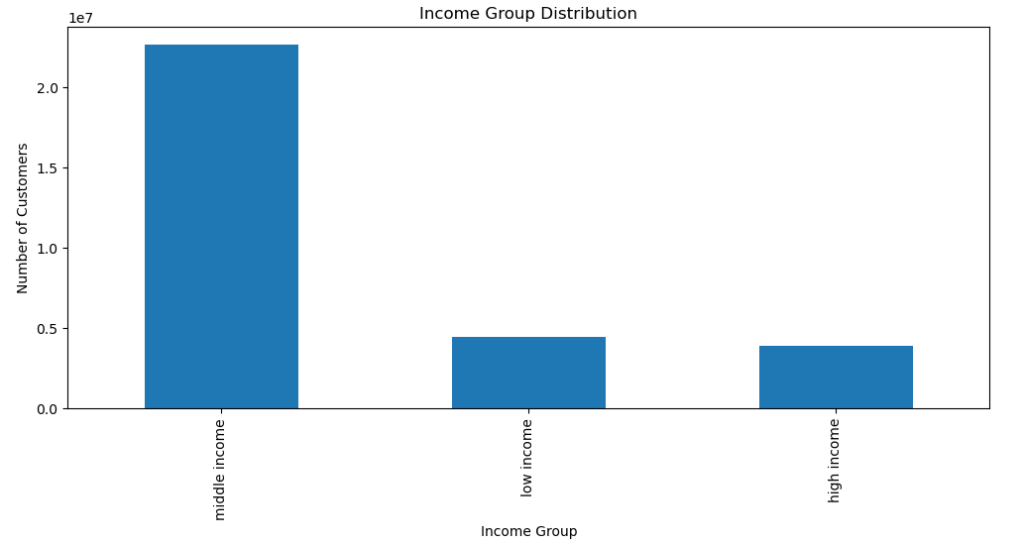
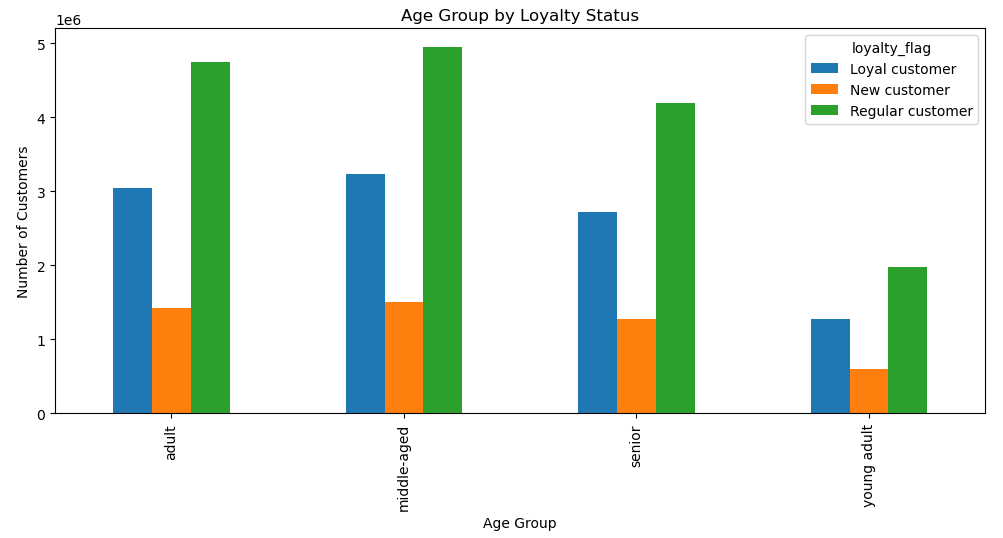
I then created visualizations for the new variables to see the distribution of customers in each category. In terms of age group, the highest percentage of customers are middle-aged and the lowest percentage of customers are young adults. In terms of income group, most customers fall into the middle-income category.
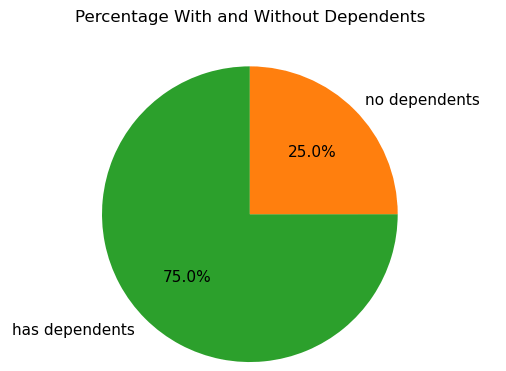
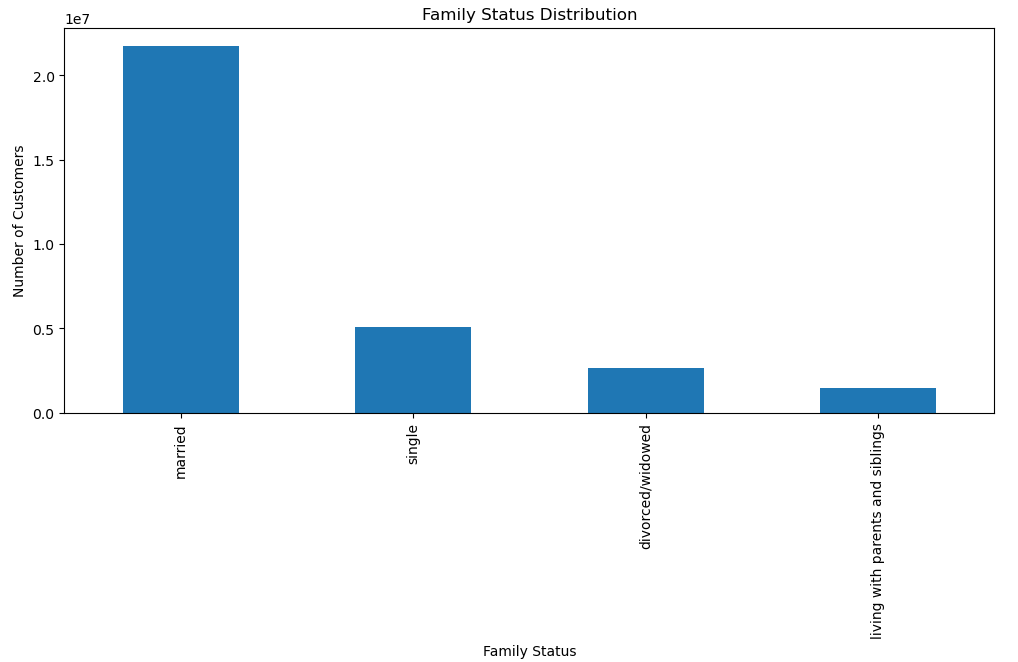
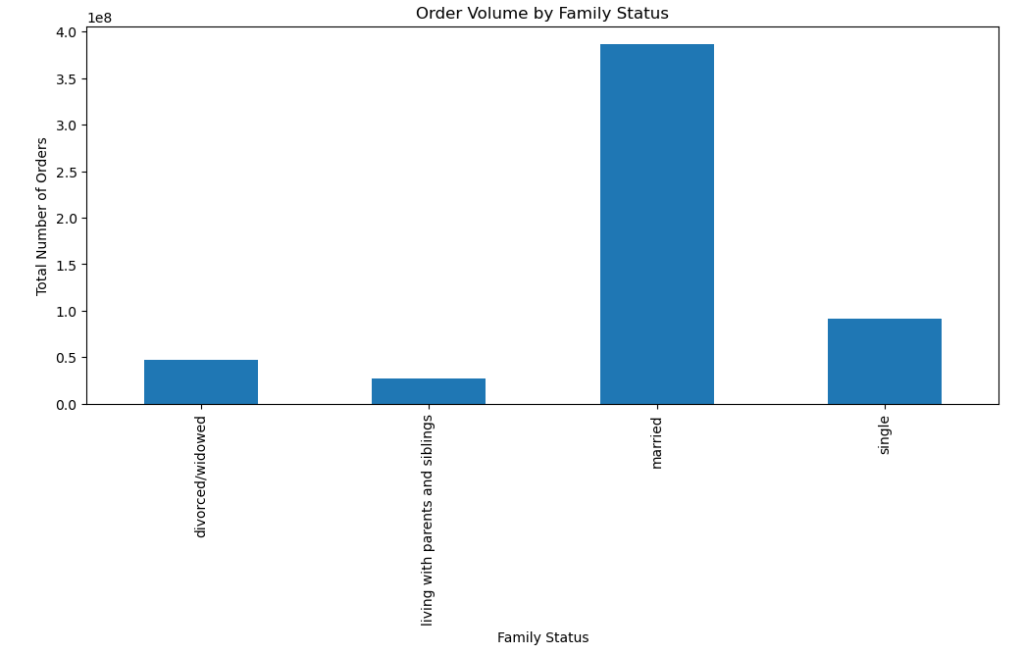
In terms of number of dependents, 75% of customers have dependents and 25% of customers do not have dependents. In terms of family status, most customers are married.
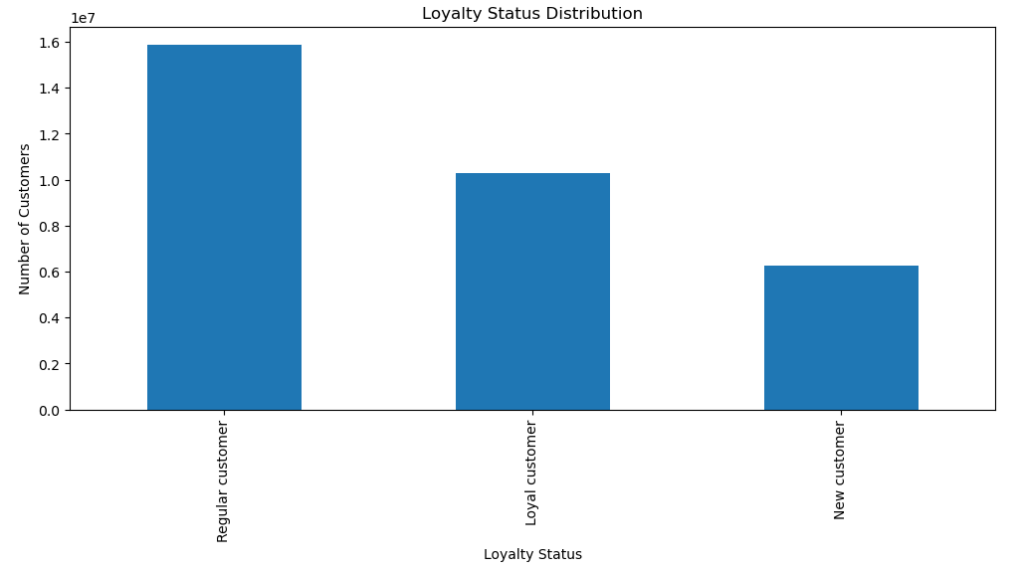
In terms of loyalty, most customers are regular customers, followed by loyal customers, and new customers.
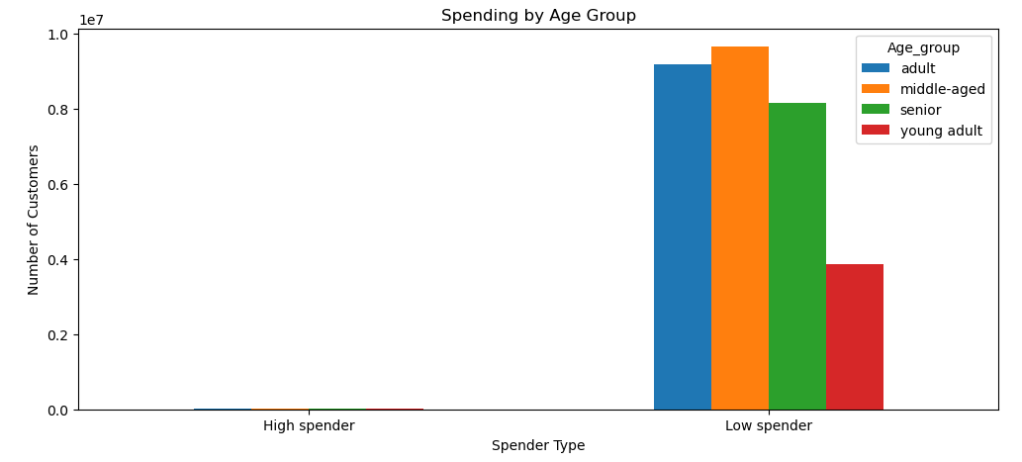
I generated visualizations of cross tabulations to explore relationships between two variables. I used multiple different combinations of variables. I found that almost all customers of all age groups are low spenders. Regardless of family status, most customers are regular customers, followed by loyal customers and new customers.
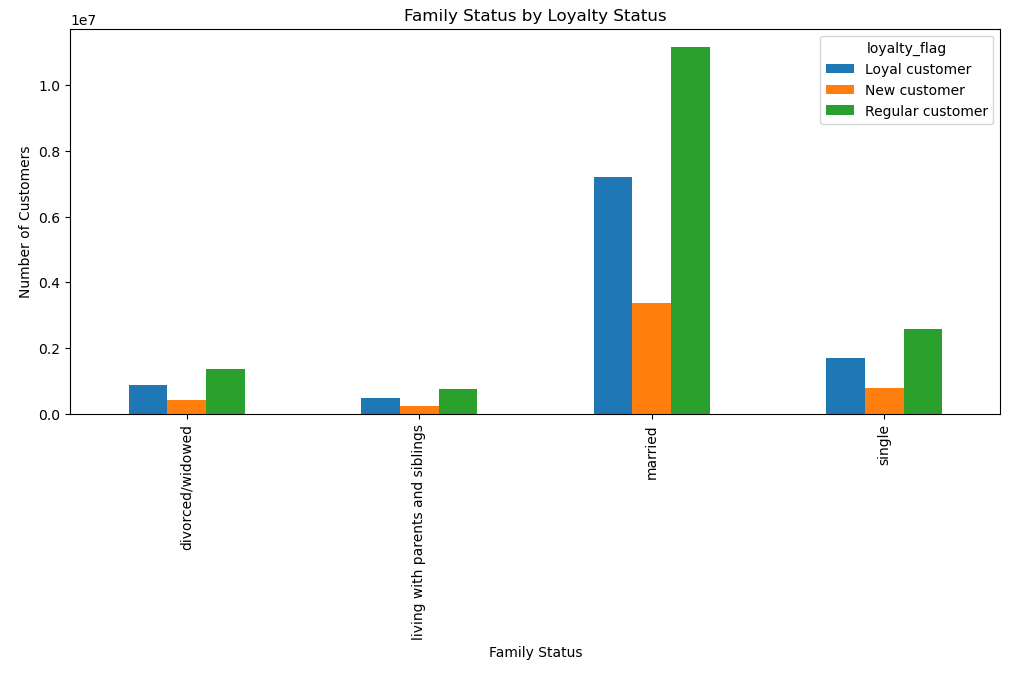
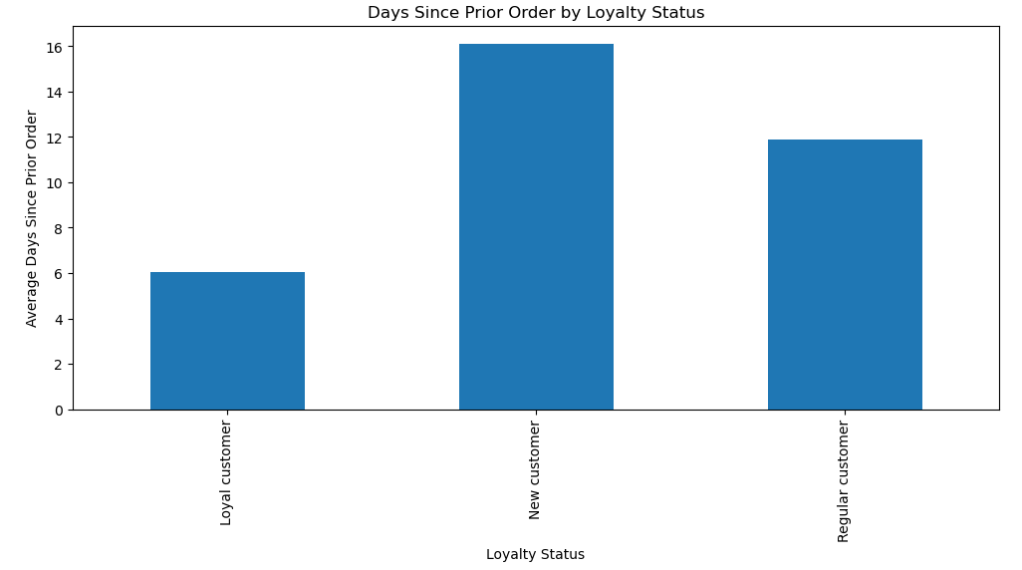
The average number of days since prior order is different for each loyalty status with new customers having an average of 16 days since prior order, regular customers having an average of 12 days since prior order, and loyal customers having an average of 6 days since prior order. Married people place significantly more orders than the other family status categories.
Loyal customers place orders mostly on Tuesdays (in the bar chart, 3 corresponds to Tuesday) and regular and new customers place orders mostly on Mondays (in the bar chart, 2 corresponds to Monday). For all age groups, the most customers are regular customers followed by loyal customers and new customers.

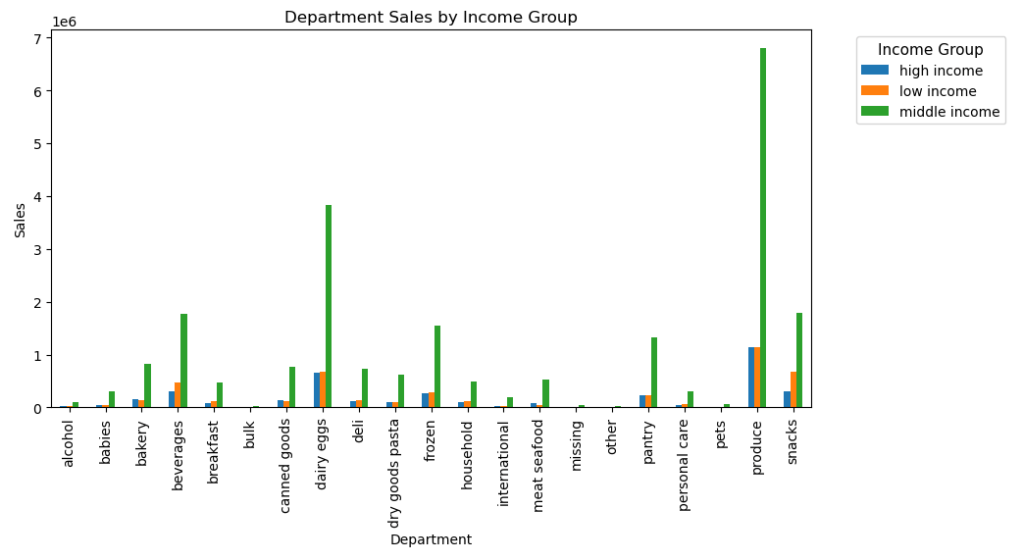
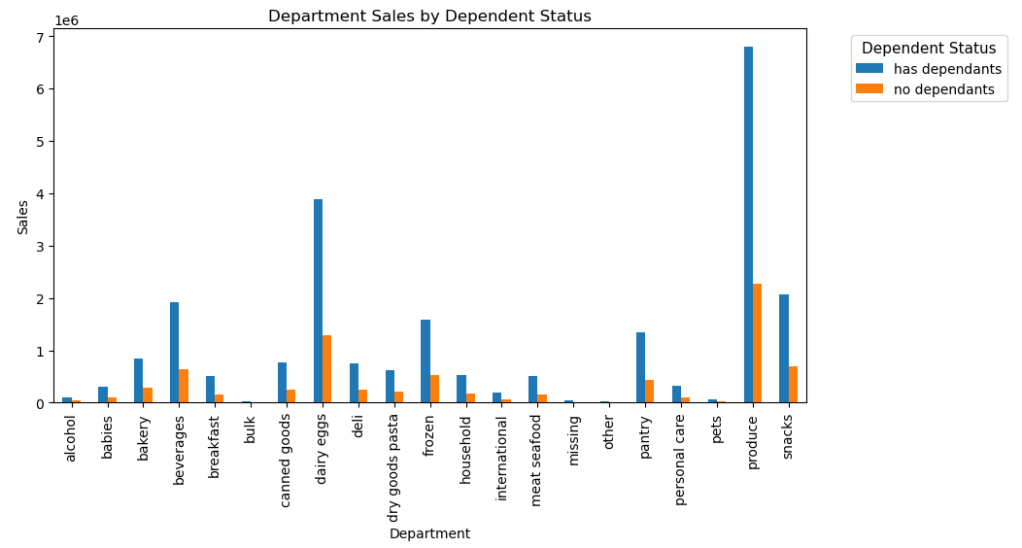
In terms of department sales, middle-income customers contribute the most to sales with the most purchases in the produce, dairy eggs, and beverages departments. Low-income customers contribute second-most to sales with the most purchases in the produce, dairy eggs, and snacks departments. High-income customers contribute the least to the sales with the most purchases in the produce, dairy eggs, and beverages departments. Customers with dependents contribute much more to sales than customers without dependents with both groups making the most purchases in the produce, dairy eggs, and snacks departments.
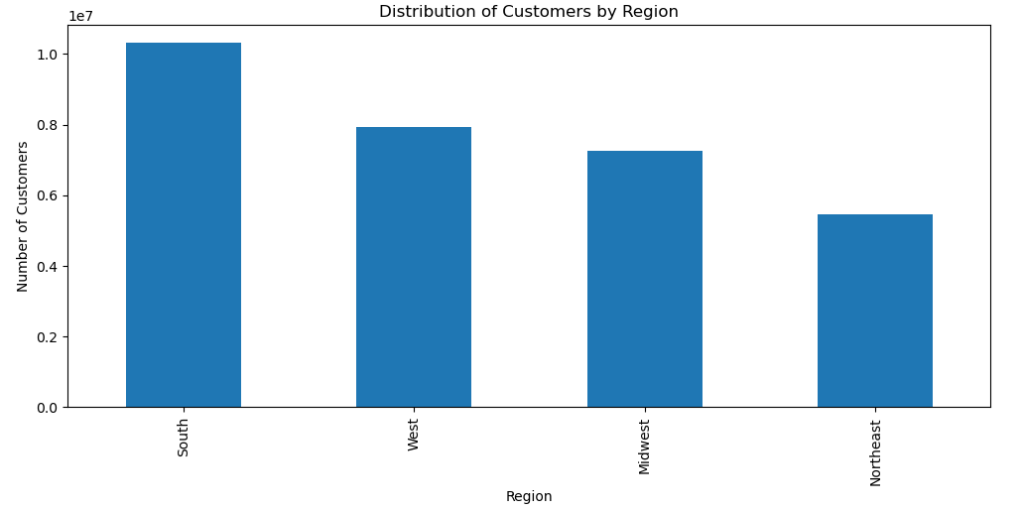
I grouped the customers into the four US regions (Northeast, South, West, and Midwest) based on the customers’ home states. The most customers are in the South and least customers are in the Northeast.
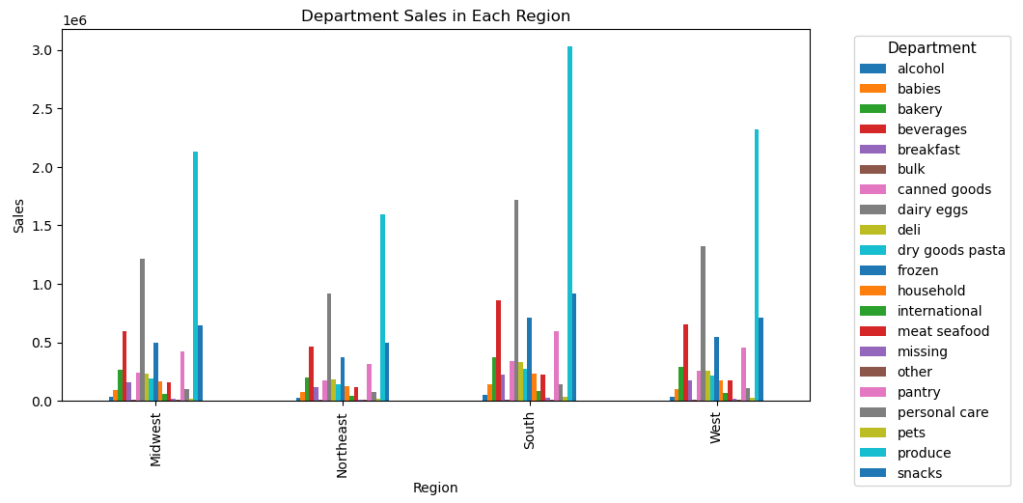
I used visualizations of cross tabulations to explore relationships between region and another variable. The top three departments from which most products are ordered (produce, diary eggs, and snacks) are the same for each region.
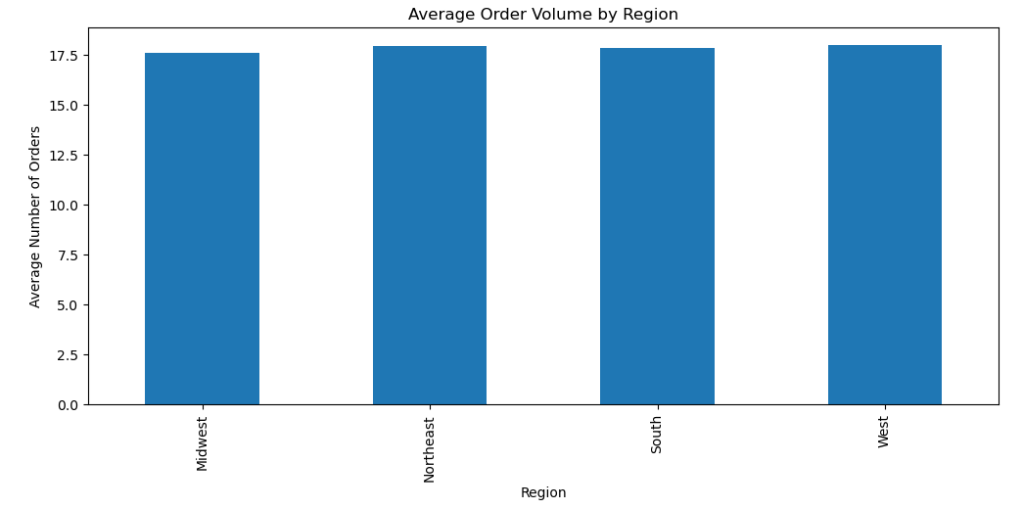
The average number of days since prior order and average order volume are the same for each region.

Results and Recommendations
Results
- The busiest days of the week are Saturday, Sunday, and Friday and the busiest hours of the day are 8am-6pm.
- People spend the most money from 8am-6pm with the peak being at 10am.
- Products can be placed into three price range groupings: low-range products (price is less than or equal to $5), mid-range products (price is greater than $5 and less than or equal to $15), and high-range products (price is greater than $15). Most products that are sold are mid-range products.
- Produce, diary eggs, and snacks are the most popular departments from which products are ordered.
- The most customers are regular customers, followed by loyal customers, and then new customers. This pattern is the same across variables such as regions and age groups.
- There are differences in ordering habits based on a customer’s loyalty status. Loyal customers have an average of 6 days between orders whereas regular customers have an average of 12 days, and new customers have an average of 16 days. Loyal customers place orders mostly on Tuesdays whereas regular and new customers place orders mostly on Mondays. Ordering habits are very similar in terms of the departments that products are ordered from for all three loyalty groups.
- The South region has the most customers and generates the most sales followed by the West, Midwest, and Northeast. Other than this, there are not any differences in ordering habits between the regions.
- There does not seem to be any connection between age and family status in terms of ordering habits.
- The demographic information suggests that the greatest percentage of customers are middle-aged, followed by adult, senior, and then young adult. Most customers are in the middle-income group. A majority of customers have dependents. Most customers are married, followed by single, divorced/widowed, and then living with parents and siblings.
- Almost all customers in all four age groups are low spenders. Middle-income customers are responsible for most of the sales, with the most purchases in the produce, dairy eggs, and beverages departments. Low-income customers come after middle-income customers in the sales generated, with the most purchases in the produce, dairy eggs, and snacks departments. High-income customers contribute the least to sales, with the most purchases in the produce, diary eggs, and beverages departments. Customers with dependents contribute much more to sales than customers without dependents with both groups making the most purchases in the produce, dairy eggs, and snacks departments.
Recommendations
- Ads can be scheduled from 6pm until 8am. Additionally, more staff can be scheduled on these days and times to meet the increased customer demands.
- Less popular products can be advertised from 8am to 6pm as there is an increased likelihood of people purchasing more products during this time.
- Advertisements can focus on products from the produce, dairy eggs, and snacks departments.
- A points system can be introduced which will encourage customers to place more orders, enabling more customers to become loyal customers.

You must be logged in to post a comment.