
Overview
Purpose and Context
The ClimateWins Weather Predictions project was a project I completed as part of my machine learning course in my data analytics program at CareerFoundry. This project showcases my skills in machine learning using supervised and unsupervised machine learning algorithms.
Goals
- Identify weather patterns that deviate from Europe’s normal weather patterns
- Ascertain if there is an increase in frequency of unusual weather patterns
- Determine what weather conditions may look like over the next 25-50 years using current trends
- Identify the safest-to-live areas in Europe over the next 25-50 years
Hypotheses
- If temperatures increase every year, then extreme weather events will also increase.
- Machine learning algorithms will accurately predict if the weather on a day is pleasant or unpleasant.
- The accuracy of weather predictions will differ for the European regions because of the differences in climate.
Data
Datasets used for this project:
Temperature Dataset
This dataset includes variables such as global radiation, snow, wind speed, temperature, and more for 18 weather stations in Europe from the late 1800s to 2022. The data was collected by the European Climate Assessment & Data Set Project.
Pleasant Weather Dataset
This dataset contains data indicating if the weather on each date was pleasant or unpleasant for 15 weather stations in Europe from 1960 to 2022.
Tools
- Python and Jupyter Notebooks: To write and execute code.
- Numpy: For numerical operations.
- Pandas: For data analysis, cleaning, and manipulation.
- OS: For connecting with the device’s operating system.
- Matplotlib.pyplot: For creating various types of visualizations.
- Seaborn: For creating statistical visualizations.
- Scipy: For more complicated numerical operations.
- Sklearn: For running machine learning algorithms.
- Operator: For using more efficient functions.
- Mpl_toolkits: For creating more interactive visualizations.
- Plotly: For creating various types of interactive visualizations.
- Graphviz: For creating graph diagrams.
- Keras: For creating deep neural networks.
- Tensorflow: For creating and training neural networks.
- Time: For performing time-related functions.
- Scikeras: For using Sklearn with Keras/Tensorflow.
- Math: For giving access to standard mathematical constants and functions.
- Bayes_opt: For running Bayesian Optimization.
- PIL: For image processing and manipulation.
Techniques
The following techniques were used in this project:
- Data cleaning
- Data scaling
- Gradient descent
- K-Nearest Neighbour
- Decision Tree
- Artificial Neural Networks
- Hierarchical Clustering
- Recurrent Neural Networks
- Convolutional Neural Networks
- Long Short-Term Memory
- Random Forests
- Generative Adversarial Networks
Preprocessing Data
Prior to using machine learning algorithms, I scaled the data. Prior to using The Recurrent Neural Network unsupervised machine learning algorithm, I removed all columns for Gdansk, Roma, and Tours as data for these weather stations was not included in the Pleasant Weather dataset. I also removed columns for wind speed and snow depth since most weather stations did not have these columns, and created the Kassel_cloud_cover, Stockholm_humidity, and Munchenb_pressure columns by copying columns from nearby weather stations with similar climates.
Utilizing Machine Learning Algorithms
Supervised Machine Learning Algorithms
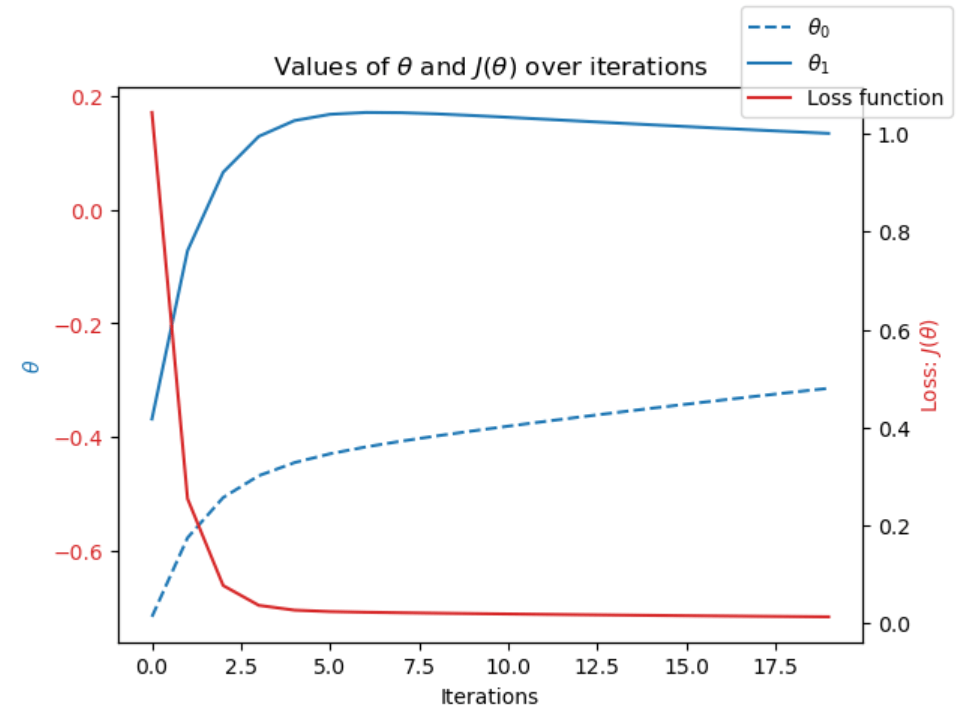
First, I used Gradient Descent to optimize the data which involved making many changes to the parameters to minimize the loss function. The iterations to the parameters brought the loss function closer to 0. Here is a visualization of the loss function, theta0, and theta1 for the mean temperature of Roma in 2020:
Next, I had to determine which of the K-Nearest Neighbour, Decision Tree, and Artificial Neural Network (supervised machine learning algorithms) would be the best one for ClimateWins to use to predict future weather. To do this, I started by testing the K-Nearest Neighbour (KNN) algorithm. For this algorithm, I split the data into training and testing sets, used a k value of 3, and ran the code. The following table shows the results of the KNN model along with the accuracy rates:
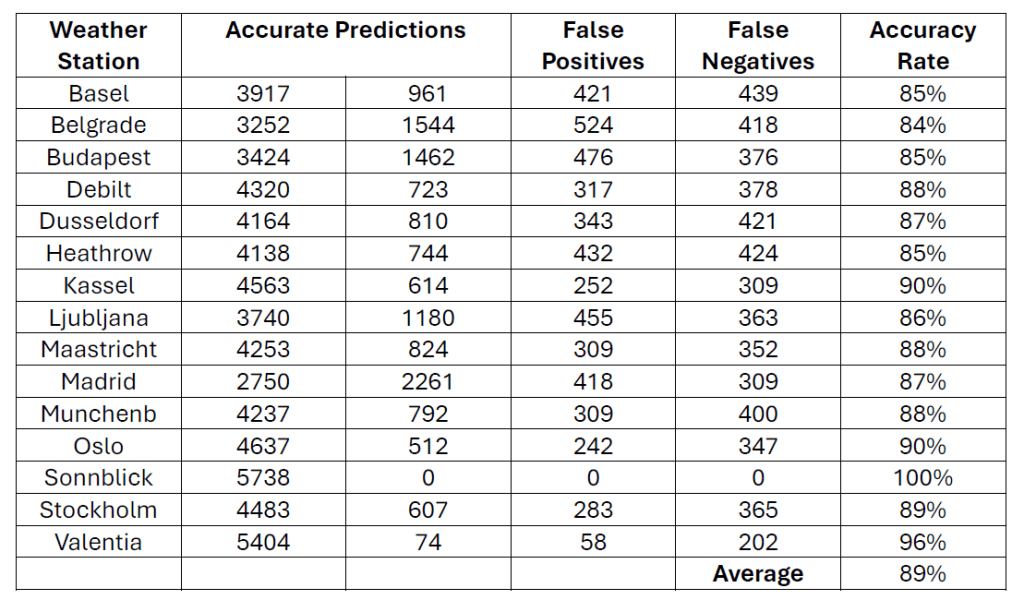
Based on the results obtained from the KNN algorithm, it can be seen that the average accuracy rate of 89% is quite good and the accuracy rate of 100% for Sonnblick, a weather station, indicates that overfitting is likely happening.
Next, I tested the Decision Tree algorithm. For this algorithm, I split the data into training and testing sets and ran the decision tree classifier. The following image shows the decision tree that was generated:
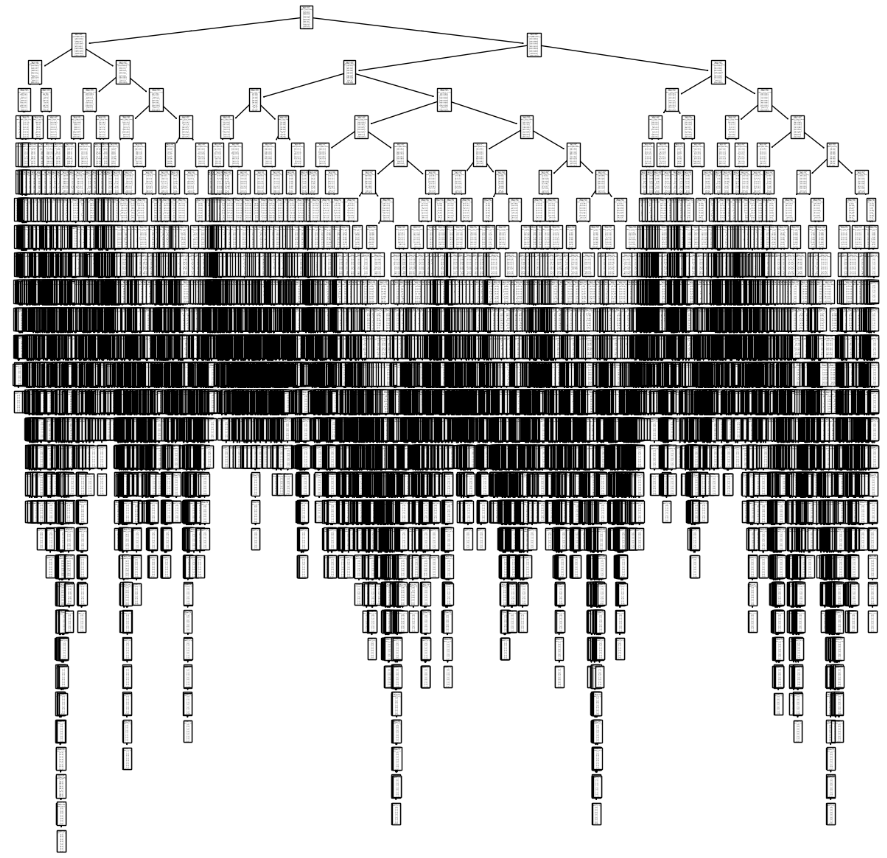
For the Decision Tree algorithm, the accuracy for the training data is 46% and for the testing data is 47%. The decision tree generated is very intricate as it has too many branches and leaves and needs to be pruned.
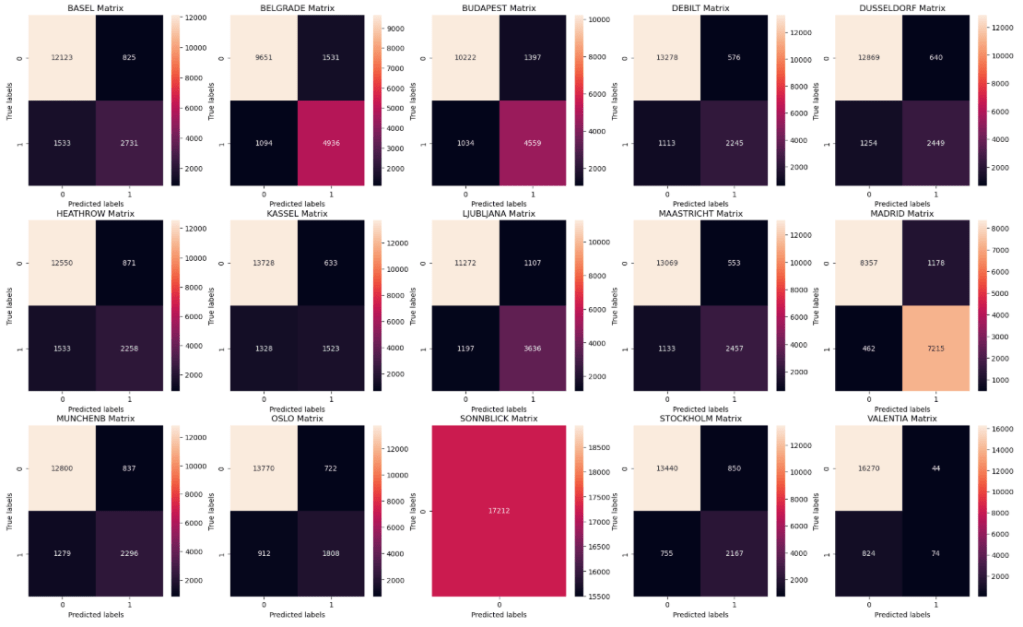
Following this, I tested the Artificial Neural Network (ANN) algorithm. For this algorithm, I split the data into training and testing sets and created three ANNs with different hidden layer sizes, iterations, and tolerances. Of the three ANNs, the one with the best accuracy rates had an accuracy of 52% for the training data and 49% for the testing data. This ANN had hidden layer sizes of (100, 50, 25), max iterations of 500, and a tolerance of 0.0001. The following is an illustration of the confusion matrices for the training data for the ANN with the best accuracy rates:
Unsupervised Machine Learning Algorithms
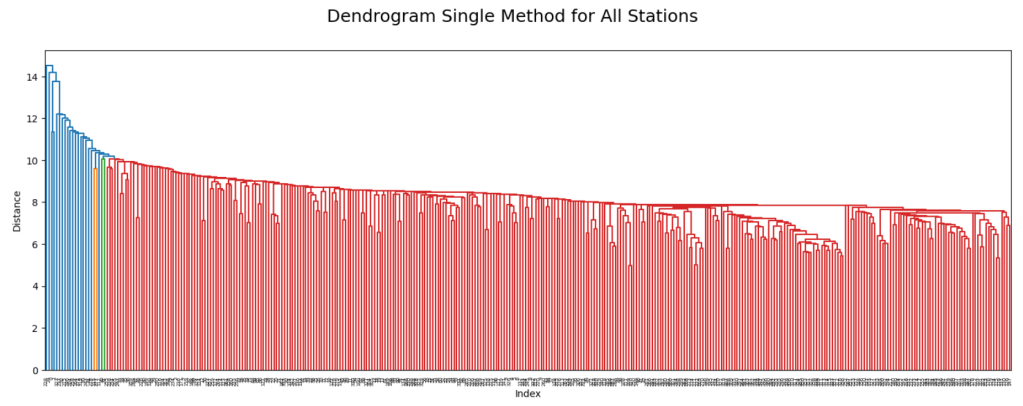
The first unsupervised machine learning algorithm I used was Hierarchical Clustering. For this algorithm, I reduced the data set to include data for only 2015. I created four dendrograms comparing the Heathrow and Budapest weather stations using the single, complete, average, and ward methods. I also created four dendrograms comparing all weather stations using the single, complete, average, and ward methods. The 2015 climate data was then reduced using Principal Component Analysis and dendrograms were produced using the single, complete, average, and ward methods. The ward method produced clusters that were easy to differentiate between. The differences in the clusters may be due to different climate conditions at the different European weather stations. The following is an illustration of a dendrogram comparing all weather stations using the single method:
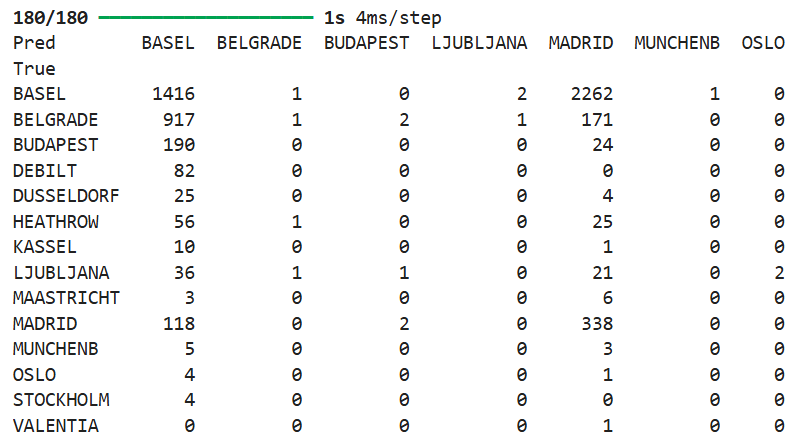
I then used the Recurrent Neural Networks model. To run this model, I reshaped the data, split the data into training and testing sets, created the Keras model, compiled the model, ran the model, and generated confusion matrices. I ran 12 tests on the model using different hyperparameters until the model converged (accuracy increased and loss decreased). The accuracy of the model was 25.4% and loss was 8.8765. The following image shows the final confusion matrix which recognized 7 out of 15 weather stations:
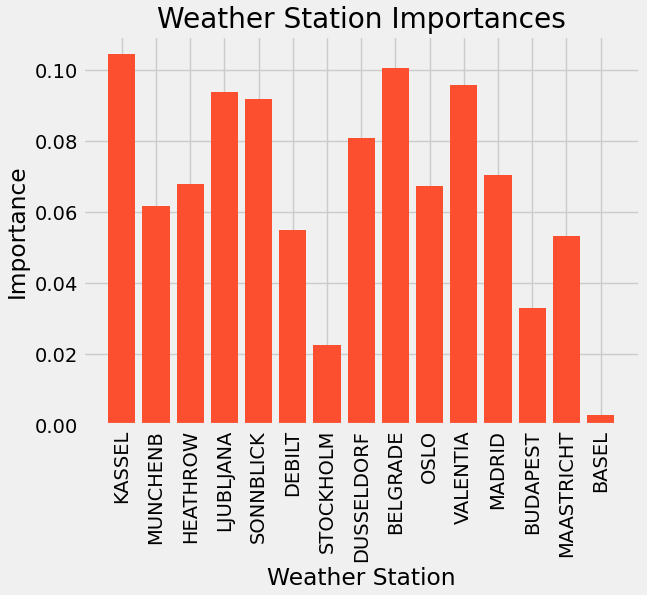
Then, I used the Random Forests algorithm. To implement this algorithm, I reshaped the data, split the data into training and testing sets, ran the model, and obtained the feature importances of the whole data set, and of each of the top three most important weather stations (Kassel, Belgrade, and Valentia). The accuracy of this model was 60.3%. The following image shows a bar chart with the feature importances for the whole data set:
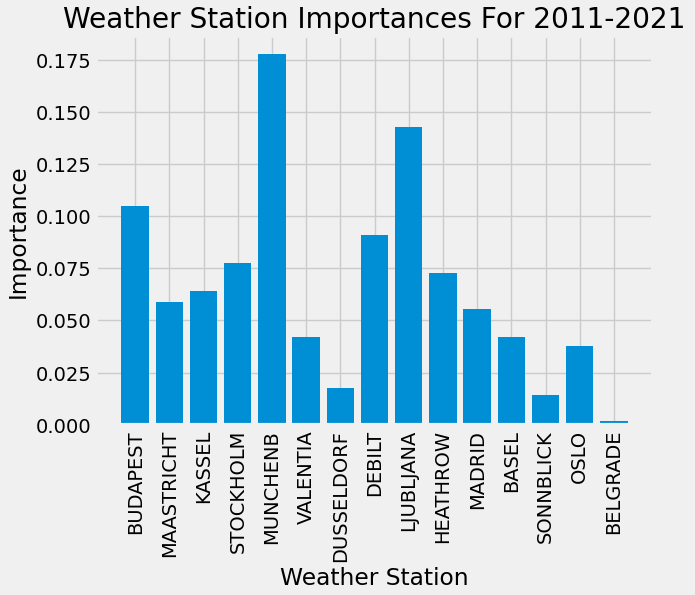
To obtain optimized hyperparameters for the Random Forests model, I reduced the temperature and pleasant weather data sets to only include data from 2011-2021, reshaped the data, split the data into training and testing sets, then ran Grid Search and Random Search to see which one had the best score. I used the hyperparameters from the search method with the highest score (Grid Search) to run the Random Forests model and obtain feature importances of the dataset. The accuracy of the model using optimized hyperparameters was 68.1%. Munchenb, Ljubljana, and Budapest were the top three most important weather stations, which was different than before optimization. The following image shows a bar chart with the feature importances of the data set from 2011-2021 after optimization:
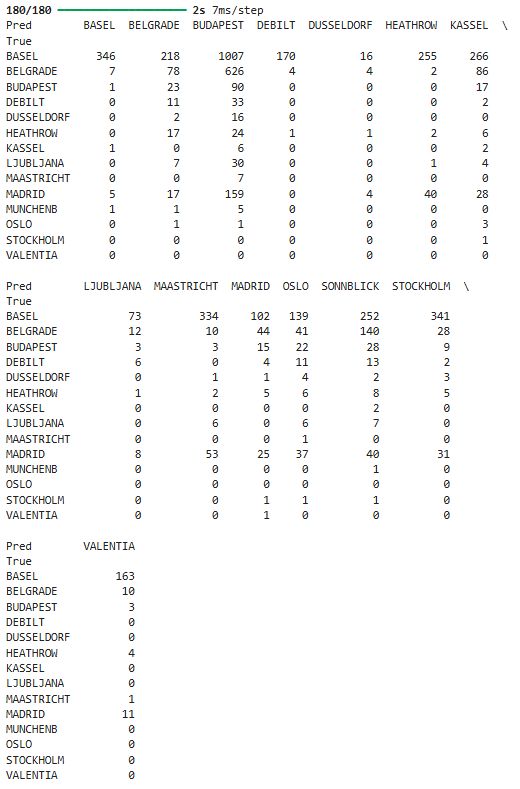
To obtain optimized hyperparameters for the Deep Learning model, I reshaped the data, split it into training and testing sets, ran Bayesian Optimization, ran the Recurrent Neural Networks model using the optimized hyperparameters, and generated a confusion matrix. The accuracy of the model after optimization was 8.3% which was lower than the accuracy before optimization. The following image shows the confusion matrix which recognized 14 out of 15 weather stations:
Results and Recommendations
I generated three thought experiments that can be used to achieve ClimateWins’ goals of using machine learning to predict the consequences of climate change in Europe:
- Identifying the safest places in Europe using Random Forests: Integrate data on sea levels, extreme weather events, and injuries and deaths due to extreme weather. The model will categorize regions by safety for the next 25-50 years.
- Predicting future weather conditions using Long Short-Term Memory (LSTM): Obtain weather predictions for the next 25-50 years by training an LSTM model using past and current weather data including extreme weather event data.
- Identifying unusual weather patterns using Hierarchical Clustering: Current and past weather data and extreme weather event data can be used to identify any anomalies in weather patterns across Europe.
Next Steps
- Collect data on extreme weather events in Europe including data on storms, natural disasters, floods, and droughts.
- Generate target labels for data which would include High Safety, Medium Safety, and Low Safety.
- Run Grid Search and Random Search on the Random Forests algorithm.
- Implement the Random Forest algorithm using optimized hyperparameters.

You must be logged in to post a comment.